
Charts are supposed to make teer results clearer, but sometimes a teer result chart 2026 leaves you more confused than before. The date looks wrong, a number seems to belong to another day, a cell is blank, or two sites show different numbers for the same session. Most of these problems are reading mistakes, not chart mistakes, and all of them are fixable. This troubleshooting guide on Teer Results walks through the common chart reading mistakes, explains what to do when dates look mismatched, shows how to verify a chart entry against the official declaration, and decodes blank or missing entries so you always know what you are looking at.

The Most Common Teer Chart Reading Mistakes
Before assuming a teer result chart 2026 is wrong, check these mistakes. They account for the large majority of chart confusion.
Reading the Wrong Market’s Column
This is the number one chart error. Combined charts place Shillong, Juwai, Khanapara and Jowai Ladrymbai side by side, and on a phone screen the columns sit close together. A reader following Khanapara can easily slide one column over and read the Shillong numbers.
The fix is simple. Before reading any number, put your finger on the market header and trace straight down to your date row. On this site you can also open the dedicated market pages to avoid combined charts entirely: Shillong Teer Result and Khanapara Teer Result.
Mixing Up Sessions
Each market runs several sessions per day: morning, day, evening and night. Each session has its own FR and SR pair. Readers often read the morning FR and pair it with the evening SR from the same date, creating a combination that was never declared.
The fix: read the session label on every row before reading the numbers. Treat each session as its own mini-chart. If you follow the day session, ignore the morning and evening columns completely while reading.
Reading the Year Wrong
A teer result chart 2026 looks almost identical to the 2025 chart. Same layout, same markets, same session labels. Search engines sometimes land you on an old year’s chart page, and everything you read from that point is a year off.
The fix: check the year printed at the top of the chart before you read a single entry. If you arrived from a search result, glance at the page title or the year tabs to confirm you are in 2026.
Reading Dates Backwards
Teer charts use the day-first format: 05-06-2026 means 5 June, not 6 May. Readers used to the month-first format misread dates constantly, especially in the first twelve days of any month when both readings look plausible.
The fix: check the chart’s date legend or the first rows to confirm the format. When a month is spelled out, such as 15 Jan 2026, trust the spelled version. For numeric dates, always read day first on teer charts.
Treating Pending as Declared
Charts show status labels like pending, declared and updated. A pending entry is a placeholder. It is not a result. Readers who screenshot a chart too early sometimes treat a pending row as the final record.
The fix: read the status before the number. If it says pending, the result has not been finalized on that chart yet. Wait for the declared update.

Teer Result Chart 2026 Date Mismatches: What to Do
A date mismatch is the feeling that the chart’s date does not line up with the result you expected. Work through these checks in order.
First, confirm the date format. As explained above, day-first versus month-first confusion is the top cause. Write the date out longhand, for example 5 June 2026, and match it against the chart row.
Second, confirm the year. If the chart is showing 2025 records, every date will feel wrong. Switch to the teer result chart 2026 year section and look again.
Third, check for timezone-free thinking. Teer dates follow the Indian calendar day. A night session declared late still belongs to that date, not to the next morning. If you expected a night result under tomorrow’s date, look under today’s date instead.
Fourth, check the market and session. A result that seems to be on the wrong date may actually be the right date in the wrong market’s column or the wrong session’s pair. Re-trace your steps: market header, session label, then date row.
Fifth, consider the holiday calendar. If your date falls on a Sunday or a public holiday, there may be no result at all. The mismatch you feel is the absence of a row you expected. A marked holiday row is the chart telling you correctly that nothing was declared.
If all five checks pass and the date still looks wrong, the chart itself may have a data entry error. Move to the verification steps below.
How to Verify a Chart Entry Against the Official Declaration
When a chart entry looks suspicious, verify it. The market’s own declaration is the primary record. The chart is a secondary compilation. Here is the verification process.
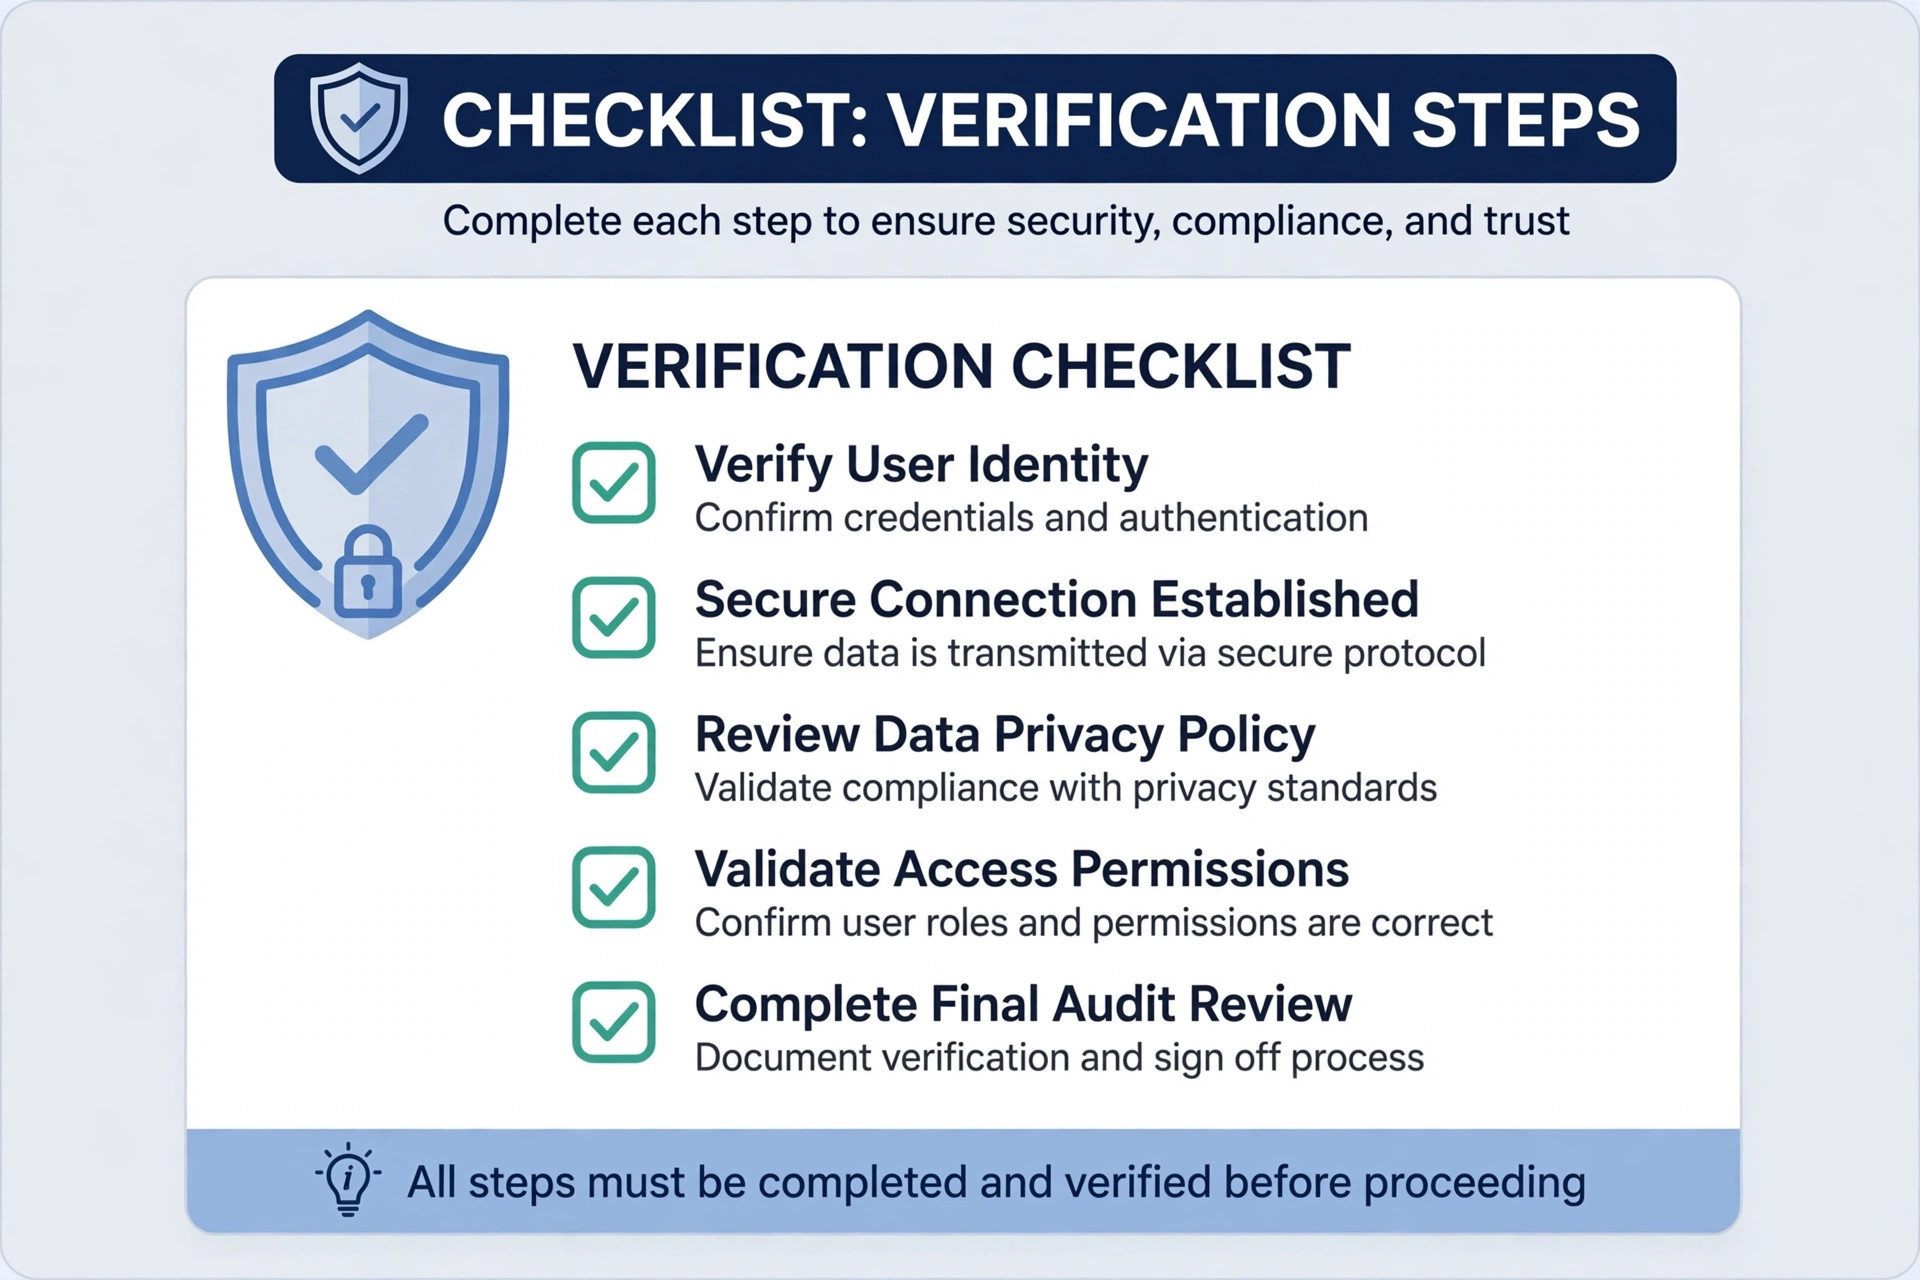
Step 1 – Capture the exact entry. Note the date, market, session, FR, SR and the chart page you read it from. A vague memory of “something looked off” cannot be verified. An exact entry can.
Step 2 – Check the daily result record for that date. The daily result page is closer to the original declaration than the monthly chart. Compare the FR and SR on the daily record with the chart entry. If they match, the chart is correct and your reading was the problem.
Step 3 – Check the status label. If the chart entry says pending or was recently updated, you may have caught the chart mid-update. Wait and recheck. Charts are refreshed after declarations, and a half-updated chart can briefly show inconsistent data.
Step 4 – Compare with another established archive. Open a different reputable teer site’s chart for the same date, market and session. If two independent charts agree, the entry is almost certainly correct. If they disagree, one of them has a compilation error.
Step 5 – Trust the market’s announcement. If the market’s own declaration differs from every chart, the market is right. Charts are compiled by humans and can carry typos. The declaration is the source of truth.
Step 6 – Report persistent errors. If a chart on this site shows an entry that contradicts the official declaration, use the contact page to report it. Accurate archives depend on readers flagging mistakes.
A note on screenshots: when you verify, compare live pages, not old screenshots. Screenshots freeze a moment in time and may show a pending entry that has since been updated.
Teer Result Chart 2026 Blank Entries Explained
Blank cells are the most misunderstood part of any teer result chart 2026. A blank does not mean zero, and it does not mean the chart is broken. Here is what blanks usually mean.
Pending Declaration
The most common cause. The session has not yet produced a declared result, or the chart has not been refreshed since the declaration. The cell fills in after the update. This is normal chart behavior, not an error.
Non-Playing Day Without a Label
Some charts do not label every holiday. A blank row on a Sunday may simply be an unlabeled non-playing day. Check whether the date is a Sunday or a known public holiday. If it is, the blank means no game was played.
Chart Update Delay
Charts are updated after declarations, not during them. There is always a gap between the announcement and the chart refresh. If you check a chart immediately after a session, expect blanks for that session. Recheck after some time.
Data Entry Gap
Occasionally a chart maker misses a row. This is rare on established sites but it happens. The signature of a data entry gap is a blank row surrounded by complete rows on ordinary playing days. Verify the missing entry against the daily record, and if the daily record has the numbers, the chart simply missed the update.
What Blanks Never Mean
A blank never means the result was zero. Teer results are two-digit numbers, and a blank cell is not a number at all. A blank also never means the result was cancelled after declaration. Cancelled sessions are marked, not blanked.
When Two Charts Disagree
Finding two charts that show different numbers for the same date, market and session is unsettling. Resolve it methodically.
First, make sure you are comparing the same thing. Different market, different session, different year: any of these makes the comparison meaningless. Align date, market, session and year on both charts before concluding they disagree.
Second, check the update timing. One chart may have updated to the declared result while the other still shows a pending or stale entry. The newer update is usually the correct one.
Third, look for correction notes. Markets occasionally correct a declared number. A good chart notes the correction. If one chart shows the original number and the other shows the corrected number, the corrected one is right.
Fourth, apply the primary-source rule. The market’s own declaration beats both charts. If you can find the market’s announcement for that session, it settles the disagreement.
Fifth, consider which chart has the better track record. Established sites with long, consistent archives are more reliable than new sites with thin histories. This is not a guarantee, but it is a useful tiebreaker when the primary source is unavailable.
Preventing Chart Problems: A Reader’s Checklist
Most chart trouble is preventable with a short routine. Run through this checklist every time you open a teer result chart 2026.
One, confirm the year at the top of the page. Two, confirm the market from the column header. Three, confirm the session from the row label. Four, read the date in day-first format. Five, read FR then SR as a pair. Six, check the status label before treating the entry as final. Seven, if anything looks off, verify against the daily record or another archive.
This takes seconds once it becomes a habit, and it eliminates nearly every mistake described in this guide. The teer result list page is a good companion for step seven, since it shows recent results in a simple sequence that is easy to compare against a chart row.
Understanding Chart Update Cycles
Charts update in cycles tied to declarations. Knowing the cycle prevents the most common frustration, which is checking too early.
After each session’s declaration, chart makers collect the numbers and update the chart. This takes time. The chart is a compiled record, not a live feed. Expect a delay between the announcement and the chart entry.
During the delay, the chart may show the previous session’s numbers, a pending label, or a blank cell. All three are normal mid-update states. None of them means the result will not appear.
If a chart has not updated long after the declaration, the cause is usually on the publishing side: a missed update or a technical issue. Recheck later. Charts on established sites catch up quickly.
One more timing point: charts update session by session. The FR may appear before the SR. A row with FR filled and SR blank is a chart caught between the two round updates. Wait for the SR before treating the row as complete.

Reading Charts on a Mobile Phone
Most readers open a teer result chart 2026 on a phone, and small screens create their own class of reading mistakes. Combined charts squeeze four markets into a narrow display, so columns touch each other and it becomes easy to read across a column boundary.
Zoom in before you read. Pinch the chart larger until each column header is clearly readable, then trace down with your finger. Do not try to read a full combined chart at thumbnail size. If the site offers a single-market view, use it on mobile. The dedicated market pages on this site load one market at a time, which removes the column-boundary problem completely.
Turn the phone sideways for wide charts. Landscape mode gives each column more room and reduces the chance of slipping into the neighboring market’s numbers. If the chart has a horizontal scroll, scroll deliberately and keep the market header visible while you move. Some mobile browsers hide the header row when you scroll down a long monthly block. Scroll back up to reconfirm the market before reading the next row.
Screenshots need the same care. If you share a chart screenshot with someone, include the year label, the market header and the session labels in the shot. A cropped screenshot that shows only numbers is unverifiable and often misleading.
Teer Result Chart 2026 – Frequently Asked Questions
Why is a chart cell blank?
A blank cell usually means the result is pending declaration or the chart has not been refreshed yet. It can also mark a non-playing day. A blank never means zero. Wait for the declared update before treating the entry as final.
What should I do if a chart date looks wrong?
Check the date format first, since teer charts read day-first. Then confirm the year section, the market column and the session label. Most date mismatches come from one of these four reading errors rather than from bad chart data.
How do I verify a suspicious chart entry?
Note the exact date, market, session, FR and SR. Compare it with the daily result record for that date, check the status label, and compare with another established archive. The market’s own declaration is the primary record and beats any chart.
Why do two charts show different numbers for the same session?
Make sure both charts cover the same date, market, session and year. Then check update timing, since one chart may have refreshed before the other. Markets sometimes correct declarations, so look for correction notes. The market’s announcement settles any remaining disagreement.
What does pending mean on a teer chart?
Pending means the session’s result has not been finalized on that chart yet. It is a placeholder, not a result. Wait for the status to change to declared before using the entry as a record.
Why does the FR appear before the SR on a chart?
Charts update session by session and round by round. The first round is declared before the second round, so the FR cell fills in first. A row with FR complete and SR blank is a normal mid-update state.
Can a chart entry change after it is published?
Yes. Charts can be corrected when the market corrects a declaration or when a data entry typo is fixed. Good charts note corrections. If an entry you recorded earlier looks different now, check for a correction note rather than assuming you misread it.
Are charts or daily result pages more reliable?
The daily result page is closer to the original declaration, so it is the better reference when the two disagree. Charts are compilations built from daily records. Both are useful: daily pages for freshness, charts for history.
Conclusion
Almost every teer chart problem traces back to a small, fixable cause: the wrong market column, the wrong session, the wrong year, a backwards date, a pending entry read too early, or a chart caught mid-update. Work through the checks in this guide before concluding a teer result chart 2026 is wrong, and verify anything suspicious against the daily record and the market’s own declaration. Read this way, charts become what they are meant to be: reliable, transparent records of the game.
Teer is a legal lottery in Meghalaya, for adults 18 years and older only. Play responsibly and use charts as information, not as betting advice.
For background on lotteries in the country, see the Lotteries in India article on Wikipedia and the official Government of Meghalaya portal.
